
In this article, we’ll look at how to use benchmarking for your resource planning – specifically, how many response units you need. Once again, benchmarking provides the big picture perspective for your stakeholders while modeling and analysis fill out the details for your service.
Choosing the right metric
To begin with, you need to choose an appropriate measurement. This isn’t as easy as it sounds. For example, utilization rate for an ambulance only service will be much different than for a combined fire and EMS service. Even within paramedic systems, a small city with a utilization rate of 30% may be unsustainable while a large city with a utilization rate of 50% may be just fine. There are economies of scale that come with size, so there is no magical utilization target that’s applicable to all systems.
That said, this benchmark is about unit availability. If you choose a cohort city of a similar size, then some kind of work per vehicle measure will give you a general idea. But even here, there are difficulties. Look at the charts below. The data is from public records of forty major fire services.
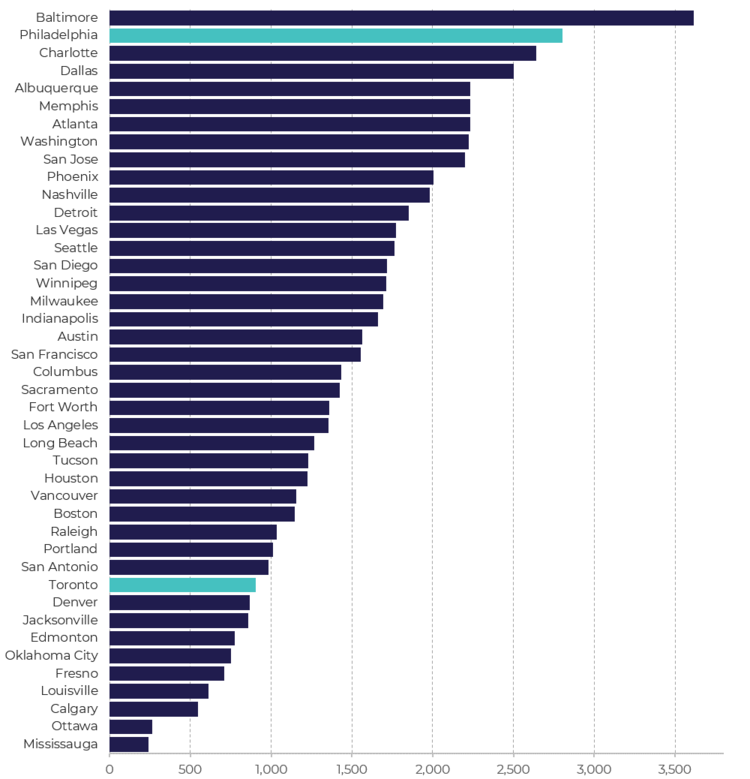
Avg Calls per Unit – 2016
On the surface, the ranking above seems to make sense. But when comparing Toronto and Philadelphia, something seems off. Toronto has nearly double the population of Philadelphia, yet one quarter of the calls. What’s going on?
The major difference here is that Toronto is a Fire only service, while Philadelphia is a combined fire and ambulance service. Toronto responds to high acuity medical calls only, while Philadelphia responds to all calls.
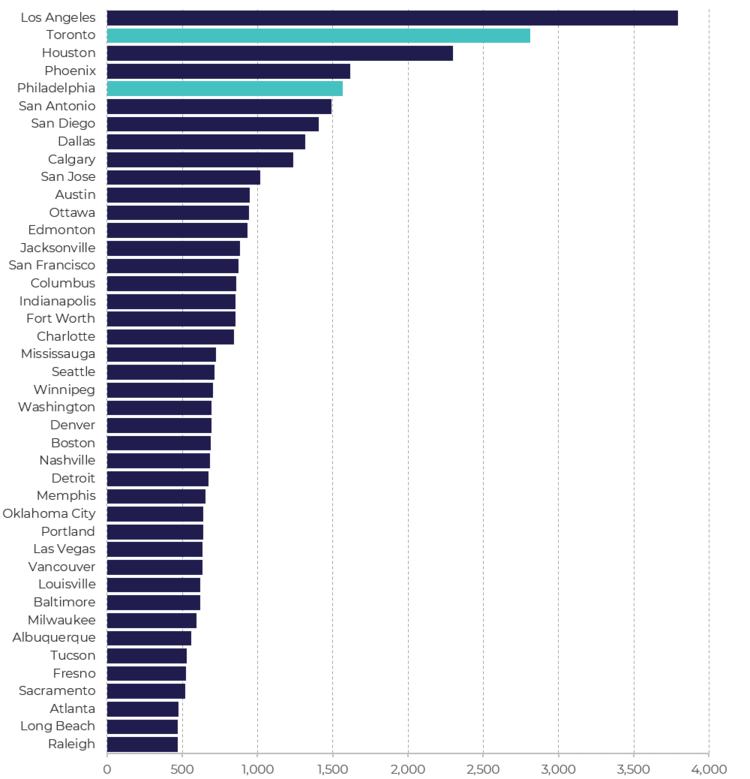
Population – 2016
This reinforces the importance of choosing the right cohort. Either pick a cohort which has the same basic profile, or limit your measure to one modality (fire or ems).
When we look at the same chart for the fire only services, we get a much more useful picture. It appears that in 2016, Vancouver and Boston had the busiest vehicles on a per incident basis.
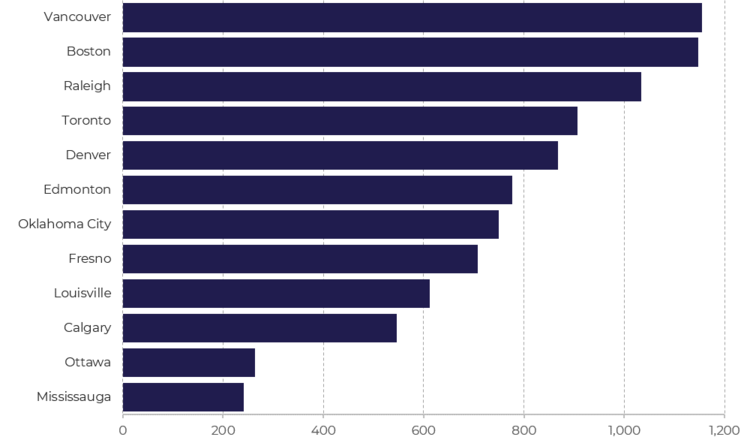
Avg Calls per Unit – Fire Only Services – 2016
What about vehicle runs instead of incidents? Isn’t that a better measure of workload? It’s true that a single call generates multiple vehicle runs and each of these impacts the workload on staff and equipment. Unfortunately, there are significant policy differences that make vehicle runs a poor measure for benchmarking.
Some fire services send three or four trucks to every alarm. Others send only one until the call is upgraded. Some ambulance services send both a primary response unit and an ALS transport unit to every high acuity call. Others just send the transport. This has a huge impact on the number of vehicle runs and, if chosen as a benchmark, could open you up to charges of “cherry picking” your measure.
Think this through carefully. Even when looking at similar services, there are policy issues that can impact the results. Do the call counts include cancelled calls or false alarms? What about specialty units like hazmat or technical rescue? Are specialized locations like airports or harbours included?
Involve your stakeholders
Be prepared to answer questions about any differences you see. If it looks strange to you, it will look strange to your stakeholders. Ideally, you should walk your stakeholders through the process of how you chose your cohort and how you determined your metrics of comparison.
Contextual benchmark data like population, population density, and land area are easy to come by. Use them to bolster your benchmarking exercise.