
Improvements in Call Volume, Workload, and Risk Assessment of Emergency Services
Forecasting is a time-honoured tradition in emergency services. It is used to support strategic plans, justify budgets, and prove to citizens that you’re not just reacting to emergencies. Forecasts can also be used to adjust resources in the short term or to target more effective inspection efforts.
Forecasts are always wrong, but that doesn’t mean they aren’t useful.
When done well, they support planning and prevent costly mistakes on capital investments. In this article, we’ll look at three types that are common in emergency services: call volume, workload, and risk forecasts.
Call Volume Forecasts
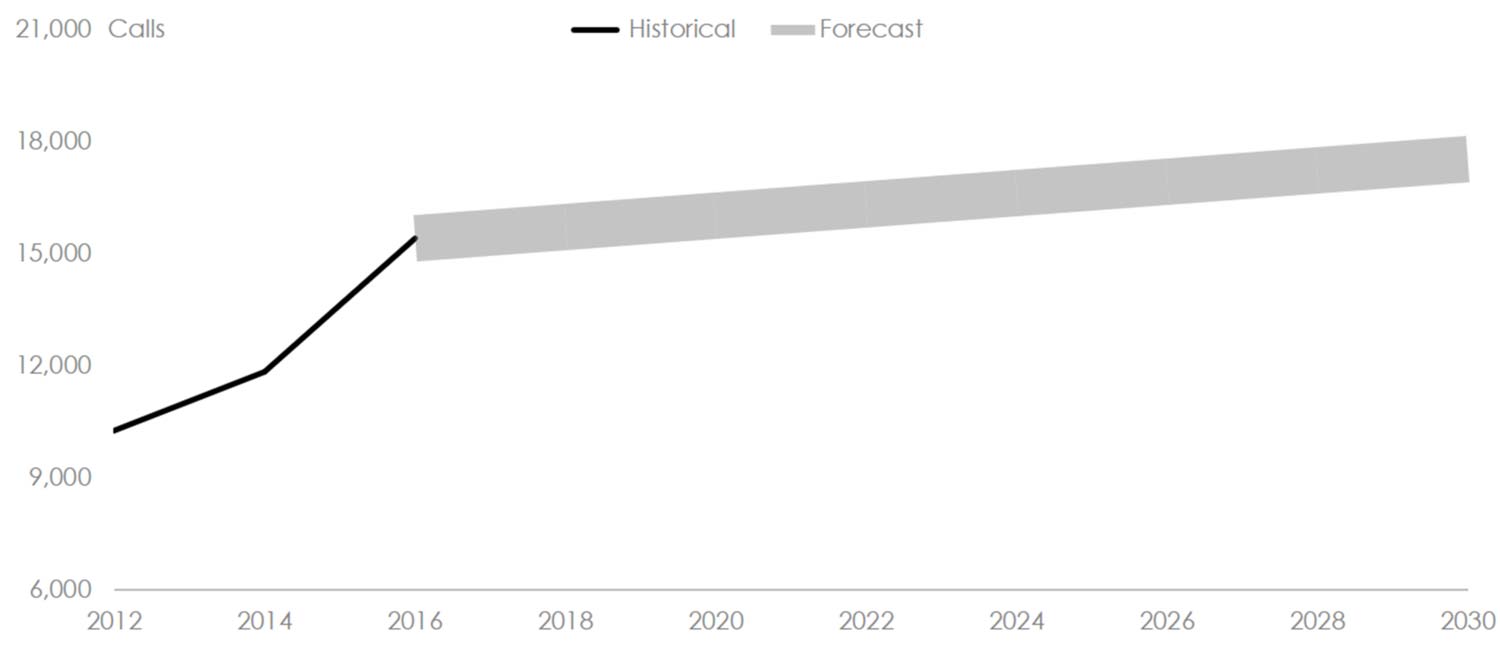
Long-term call volume forecasting is one of the main inputs to capital and master plans and is used to anticipate station, vehicle, and personnel needs. Creating an overall forecast for a jurisdiction is reasonably straightforward. Call volumes are highly correlated with population levels and historic patterns. Over the long haul, they will stabilize around a rate per population. Simply extrapolating population growth and multiplying by the current call rate per population gives a sensible result.
It’s possible to refine this further by considering daytime population, income levels, expected age, and transit population (vehicles passing through a jurisdiction), but the improvement in accuracy typically doesn’t justify the effort. Benchmarking against similar communities to compare stations per call or response vehicles per call can also provide a rough guide for capital planning.
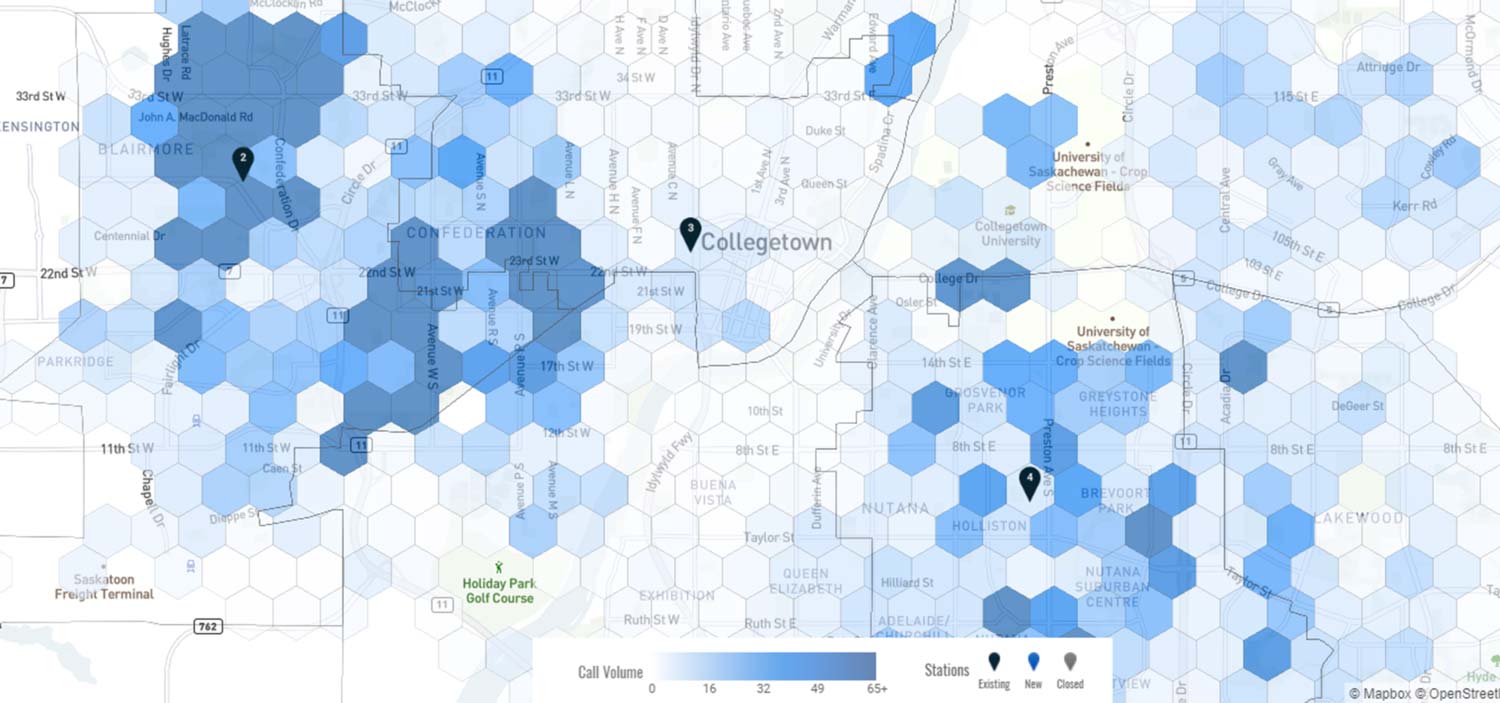
To have a forecast that’s useful for station location planning requires much more effort. Communities don’t grow in concentric circles from the downtown core. Land is developed in clumps and dependant on job prospects, utility access, transportation, and other factors. What’s needed is a spatial forecast. You want to know where all those calls are going to originate.
Fire, ambulance, and police call drivers are persistent. The same neighbourhoods and even the same buildings continue to drive call volumes year after year. (In fact, in one large city, a single bar accounted for 1% of all ambulance calls. The city eventually forced the bar to close). This is good news for planning because there is some stability to the location and volume of calls.
As a city grows – either vertically or horizontally – you will have to account for these new potential locations. Here the development plans and zoning will become your friend. Commercial and industrial developments tend to have similar call rates per square foot of area (a proxy for population visits or employees).
Residential areas are driven off of population. Look at the expected population for a neighbourhood when fully built out. Your station plan is for the long term, not immediate needs. We recommend using a rate based on your current residential calls. Even though new housing developments will have a certain profile of residents (perhaps young families), neighbourhoods change over time. This approach works in new neighbourhoods or densifying neighbourhoods.
The one wrinkle to consider is retirement centers. Although a typical neighbourhood will start out with young families, move to empty nesters, and then return to young families, clusters of retirement centers will form. These tend to drive calls at a much higher level than the typical population, and they are persistent.
Workload Forecasts
Many services have the ability to bolster staffing for special events. During a summer festival or major storm, proactive departments will often staff up in anticipation of the higher call load. What’s less well understood is that it’s possible to predict call volumes that aren’t driven by a particular event.
Researchers found that relatively simple models provide a reasonable level of accuracy at a daily and even hourly time horizon – roughly one day in advance. In simple terms, the number of calls today is a decent predictor of the number of calls tomorrow. This is probably driven by a combination of weather, flu outbreaks, moon phases, and other external factors. So how is this useful for an emergency service department?
It’s conceivable that a service could add some flex capacity on top of its base shifts. If tomorrow was predicted to be a very low day, no flex capacity would be called in. If it was expected to be a busy day, maybe all of it would be called in. This would allow a more efficient use of increasingly scarce personnel resources to gain an incremental improvement.
Risk Forecasts
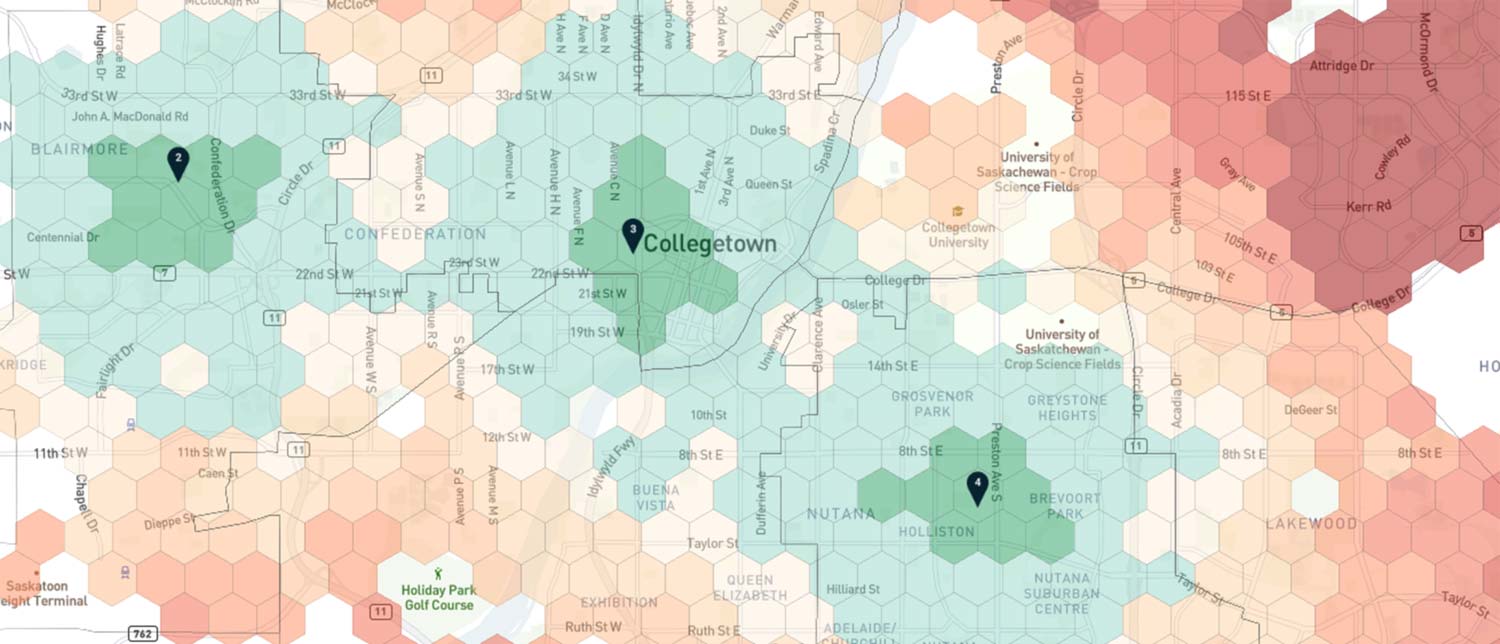
The third type of forecast deals with risk and has a time horizon in the medium term (one or two years). Risk forecasts are all about the spatial fidelity. The goal is to identify the actual structures that are high risk so that pre-emptive action can be taken.
Most of the research in this area has focused on fire risk, although the concepts likely apply to emergency medical calls as well. Initial work in the London fire brigade concluded that there was the potential to identify high risk properties based on building and demographic attributes. The work was extended in Atlanta and New York. The Surrey Fire Service (Canada) was able to implement a model and then verify the impact on structure fire rates and deaths. The work was so successful that it was extended to the entire province.
In each of these studies, there were common drivers of fire risk: neighbourhood demography, the presence of children or elderly residents, and whether the building had failed a previous inspection. By focusing on the higher risk buildings in inspections, fire services are able to more effectively use their scarce inspection resources. The NFPA has in fact committed to release a tool to help fire departments prioritize prevention activities in their jurisdictions.
This forecast uses the most advanced techniques and draws on the widest array of data (inspection results, demographics, building details, etc.). Several jurisdictions have found that machine learning techniques yield the best results. That said, there is low-hanging fruit. Simply asking experienced fire or ambulance crews their opinion will help prioritize the most obvious targets.
Forecasts and Accuracy
As we mentioned, forecasts are never perfectly accurate, but that doesn’t matter. They simply need to be accurate enough for the decision at hand.
In the first case (call volume forecasts), you simply need a credible estimate that will support budget planning for new equipment and personnel. When doing station planning, you need the additional spatial dimension to know where the calls will originate. But it doesn’t need to be overly precise. A neighbourhood estimate is almost always sufficient.
In the second case (near term resource need forecasting), the forecast model itself may be very simple (“how many calls did we have today?”). It will be wrong more times than not, but over time, you will benefit from the incremental improvements in staffing.
Risk forecasting is perhaps the most difficult, but again, it doesn’t need to be perfect. The forecast informs risk reduction efforts like home fire safety visits or inspections. These activities are going to occur anyway, so as long as the forecast is better than random, it will have an effect.
Forecasting is a tool that helps you avoid costly mistakes. But it can also be used in daily operations to improve staffing efficiency and prevention effectiveness.
Read more: