
Travel times are closely tied to response emergency performance. Planners have used them to locate stations for decades, and insurance companies use them to set home insurance premiums. Your drive times are the foundation on which a lot of planning rests.
In general, travel time is the largest component of your response. Although it’s relatively easy to measure, it’s tough to evaluate because virtually every response travels a different distance. On the surface, it seems you can’t do much short of adding or moving stations.
In fact, if you dig into them, travel times hide a wealth of insights about your system. And fortunately, there are low-cost ways to take advantage of them.
1. Take a look at your station catchment zones (or run areas). Are there certain locations where the out-of-zone vehicle is consistently arriving before the in-zone vehicle? You can plot your demand locations based on the most frequent first responder to derive “actual” zones. Compare this to the ones your dispatchers use to assign vehicles.
You might see something like the image above. Notice how station 14 is responding south into 19’s catchment. Adjusting these boundaries makes sure you are sending the appropriate vehicle with the best chance of arriving quickly.
2. Another issue hiding in travel times is your unit availability. Look again at the map above – particularly at station 17. Notice that it completely disappears in the “actual” view. This means the majority of calls in the run area are being handled by neighbouring stations. There could be a number of reasons (17 is the common brownout station, maybe it’s first to be used for backfill, or maybe it’s often tied up at a nearby hospital), but they all lead back to unit availability at that location.
You might look at bolstering deployment, changing your backfill plan, or choosing a less busy location for training brownouts. Again, doing so will have an impact on your travel times and response performance.
3. Sometimes, travel times can hide a turnout problem. Crews may be booking en route and then parking on the tarmac in front of the station to await the rest of their crew or consult their maps. If you have access to Automatic Vehicle Locator (AVL) data, you can identify stations or crews where these type of issues exist.
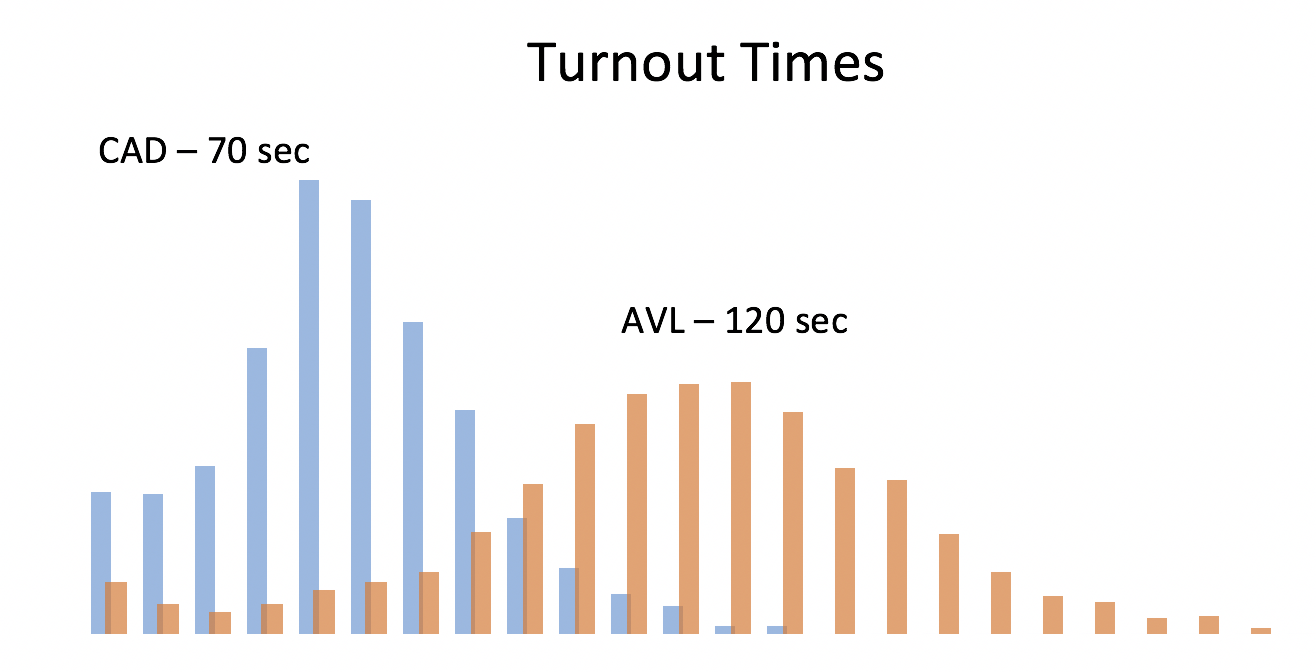
In some cases, the differences can be quite large. In the example above, an extra 50 seconds of turnout or chute time is being added on to travel times.
4. Long travel times may be due to poor route choice. Using AVL data, you may be able to identify certain neighbourhoods where crews are getting lost or certain crews who are frequently taking the wrong route. Ideally, use an “expected drive time” to compare against the actual drive time to quickly identify problem calls, crews, or areas.
5. Travel times might not actually be the problem, but are capturing the mobile data terminal (MDT) button-press errors. If crews forget to use their MDT when they arrive on site, they’ll have long drive times and short scene times. Conversely, they may be timestamping early and creating lower than expected travel times. Cleaning these up will allow you to understand better how you are doing on your response performance and give you a more accurate picture of operations.
There are a couple other approaches that are lower cost than building a new station.
6. Traffic pre-emption has been demonstrated to improve travel times by tens of seconds. It has the added benefit of improving staff safety (Iess confusion in intersections) and reducing vehicle maintenance (reduced braking and acceleration). Even installing pre-emption on just a handful of critical intersections can make a huge difference.
7. Finally, changing your fleet mix can help a lot. Several cities have found that putting paramedics on smaller, more nimble vehicles (or even bicycles), improves response time without negatively impacting service. Similarly, several fire departments are experimenting with more suitable vehicles for medical first response and other low-risk calls. The response arrives more quickly, and the more specialized units (whether fire suppression or EMS transport) are available for other calls.
So although travel times are seemingly tied to station location, there are a lot of areas where you can improve them without massive capital expenditures. A little exploration of your CAD or AVL data can go a long way.