Response performance is the most common standard by which emergency services are judged. It’s integral to the evaluation of both ambulance and fire services. It drives investment, budget decisions, and resource deployment. Poor response performance can lead to unfavourable press coverage, financial penalties, lawsuits, or changes in leadership.
The majority of urban centers in North America use a fractile response target to measure their system performance of either eight or nine minutes 90 per cent of the time. (Using the formulation X per cent in Y minutes). The National Fire Protection Association sets a target response of nine minutes, 90% of the time for urban calls.
But does it actually make a difference?
It makes intuitive sense that faster is better. A quicker response will reduce the amount of structure damage in a fire. If a citizen isn’t breathing or needs defibrillation, intervention within two minutes is surely better than 20. But keep in mind, these are a small subset of calls. The vast majority of fire and EMS calls do not benefit from a rapid response.
Public perception seems to go the same way. Patients believe they have received better service if there is a quicker response; homeowners count the seconds before fire suppression arrives. Even for cases where a quick response isn’t strictly necessary, the stress associated with waiting for first responders is real.
So why nine minutes?
The original study of response times was conducted in Seattle in the 1970s by Alvarez and Cobbs. They found a lower mortality rate in patients reached in eight minutes or less than those in nine minutes or more. (Their research relied on punch clocks that didn’t display seconds, so some services use 8 minutes, some use 8:59, and others now use 9 minutes). This research informed the decisions of municipalities around the world and the nine-minute standard is now nearly ubiquitous for both Fire and EMS.
Unfortunately, subsequent research has called into question the importance of the nine-minute target. Several studies by Pons, Eisenberg, and others have found a more significant threshold of around five minutes for the most critical patients (cardiac arrest in particular). Studies of fire damage and response time have found mixed results. There is some evidence that flashover typically occurs around nine minutes after a fire starts, but other studies have found much faster or slower times.
Although they don’t agree on a common threshold time, they all agree that time is critical in a subset of emergency events. Faster is better.
The newer studies reveal something else. The outcomes are not binary at a particular time threshold. In other words, the house is not destroyed or the patient does not die once a magic response time is passed. Instead, the probability of death increases linearly and the amount of structure destroyed does the same. We can see this graphically in the images below.
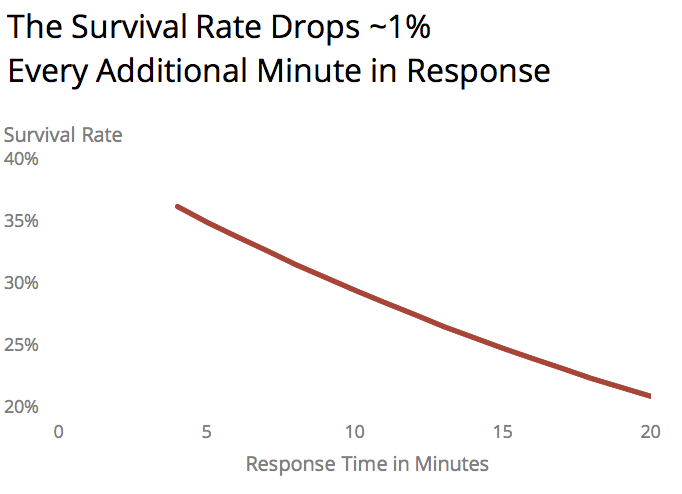
Figure 1 – Cardiac survival from 911 to defibrillation taken from Karch et al study of cardiac arrests in Las Vegas casinos.
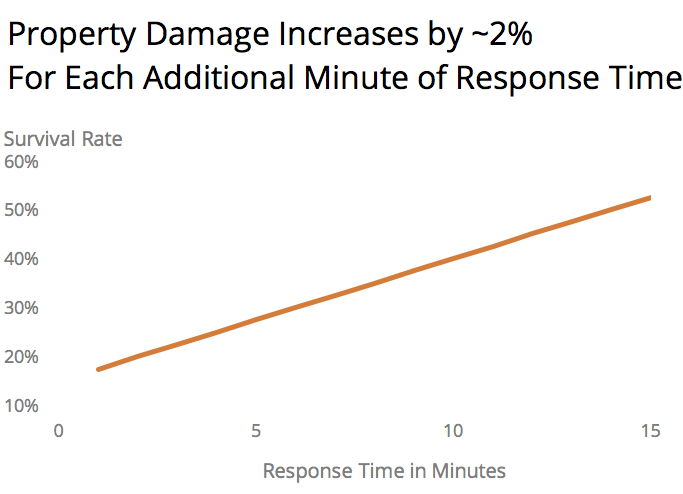
Figure 2 – Value lost in structure fires as a function of response time. Adapted from Challands’ study of New Zealand fires published in Fire Technology 2010.
For cardiac arrests, there are dozens of studies on mortality and response times. Most report that mortality improves as response time decreases, though the steepness of the relationship varies substantially. Nevertheless, every minute in response time means more lives saved.
As to fire loss and response times, there have been fewer attempts to prove the link, but the findings of the New Zealand paper are in line with the controlled experiments of fire spread and flashover rates. Every minute is worth thousands of dollars in property damage.
What is most interesting about these studies is to use the results as inputs in the strategic planning process. For example, it is possible to estimate how much property damage can be averted by adding or moving a fire station. Similarly, we can see how many lives could be saved by adding a single ambulance station.
In a study we did for a moderate-sized suburban community (population ~50,000), we found that adding a third combined fire/EMS station would save $75,000 per year in property damage and save one additional cardiac patient’s life every year.
The charts below show this effect through time:
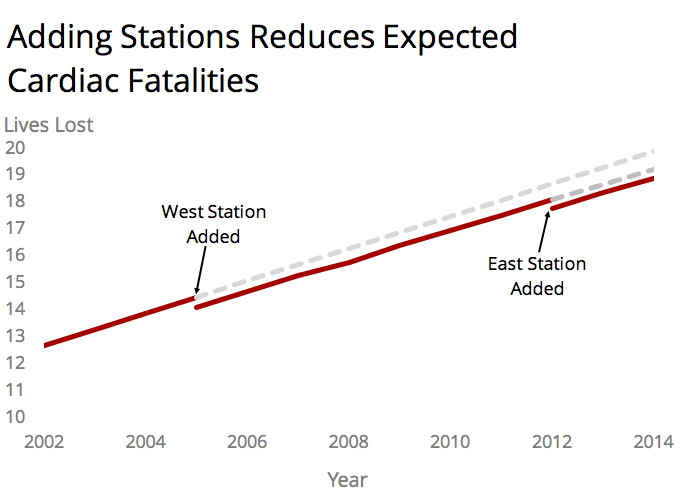
Figure 3 – Impact on cardiac fatalities of adding additional stations. Adapted from a study for the City of St. Albert, Canada.
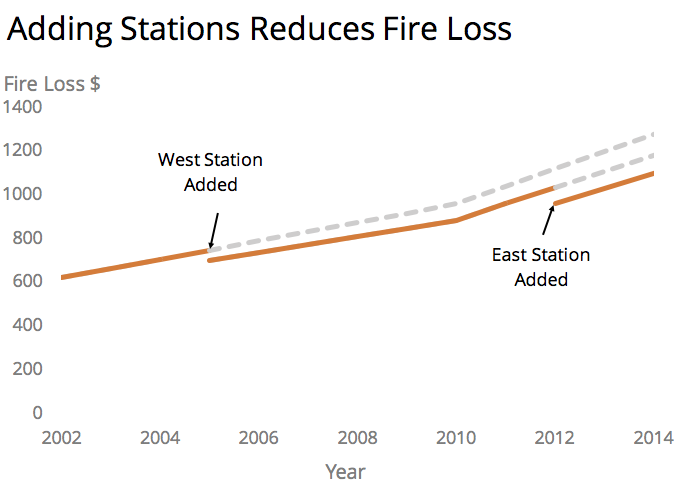
Figure 4 – Impact on fire loss of adding stations. Adapted from St. Albert study.
Although the results will vary significantly depending on the size and type of community, it is clear that there is value in translating the impact of resourcing decisions into a currency that is readily understood.
So what’s the bottom line? Improving response times will indeed move the dial on lives saved and/or property damage averted – even though this is driven by an extremely small subset of calls. With a little work, you can approximate the relationship between response performance and more concrete measures like lives or dollars. While “an improvement from 87% response performance to 90%” may sound good, “25 lives and two million dollars” has a far more relatable impact.