
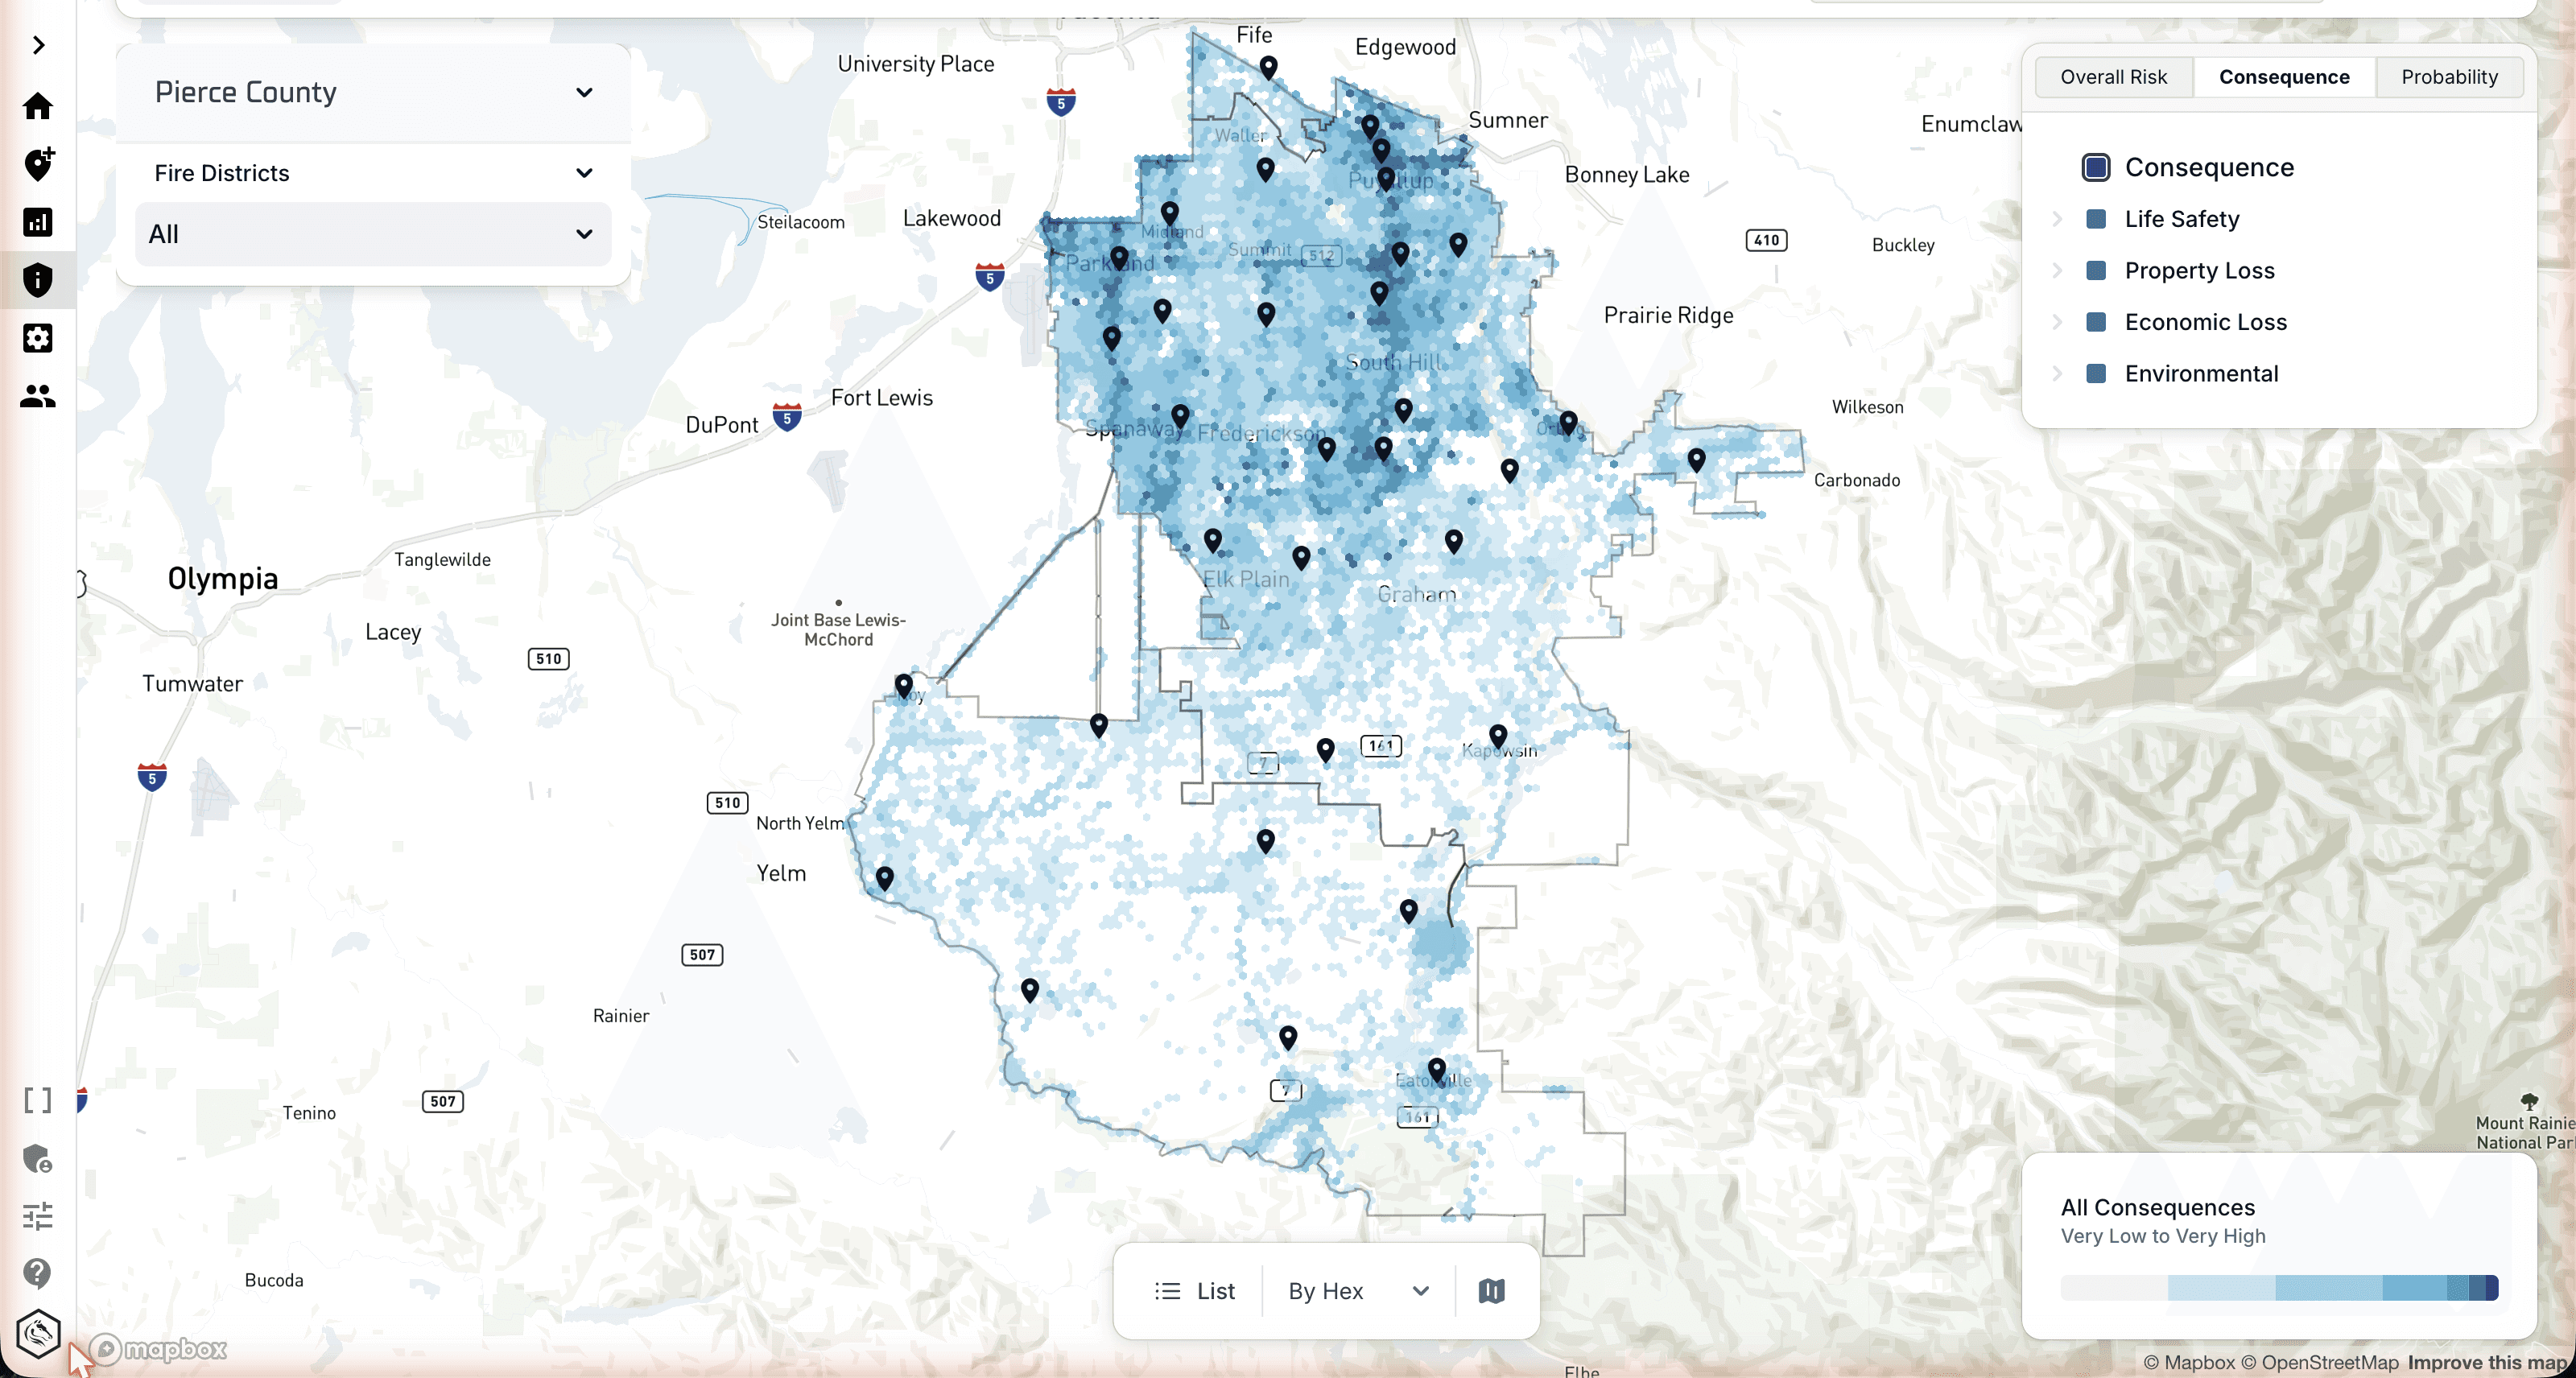

Why we created Darkhorse Risk
01
City leaders want to help. They need something they can see.
Making the case for home safety visits, fire education, or resource reallocation is hard when all you have is static PDFs and gut instinct.
02
Most tools aren’t keeping up with risk reduction.
Call volumes climb, budgets tighten, and root causes like aging buildings and high-risk populations go unaddressed. Departments get stuck reacting instead of preventing.
03
Traditional CRAs are stale before they’re printed.
Spend thousands on a one-time assessment, or build one manually from outdated spreadsheets. Either way: a binder full of charts no one has time to read.
Key Features
Tap any card to go deeper.
Connected Data
50+ datasets. One risk picture.
US CENSUS · HIFLD · CDC
NFIRS · PARCEL DATA · LOCAL CAD
YOUR CRA
+
Fast Implementation
From data to action in days.
TRADITIONAL CRA
12 MO
DARKHORSE RISK
DAYS
+
Always Up To Date
A CRA that never goes stale.
LIVING CRA · CURRENT
PRINTED BINDER · DECAYING
+
Presentation Ready
Walk into council with the answer.
SHARE · EXPORT · PRESENT
+
Custom Risk Scoring
A method you can defend.
PROBABILITY
CONSEQUENCE
IMPACT
WEIGHTS YOU SET. A PROCESS YOU CAN TEST.
+
Modern & Intuitive UX
Zero guesswork. For everyone.
ANALYSTS · CHIEFS · PREVENTION OFFICERS
+
Watch Darkhorse Risk action
Darrell Reid, retired Fire Chief and City Administrative Officer, walks through the four pillars of Darkhorse Risk in four short films.

1:02
EPISODE 01
Geospatial, Multi-Axis Risk Assessment
DARRELL REID · RETIRED FIRE CHIEF & CAO

1:01
EPISODE 02
Custom Risk Scoring
DARRELL REID · RETIRED FIRE CHIEF & CAO
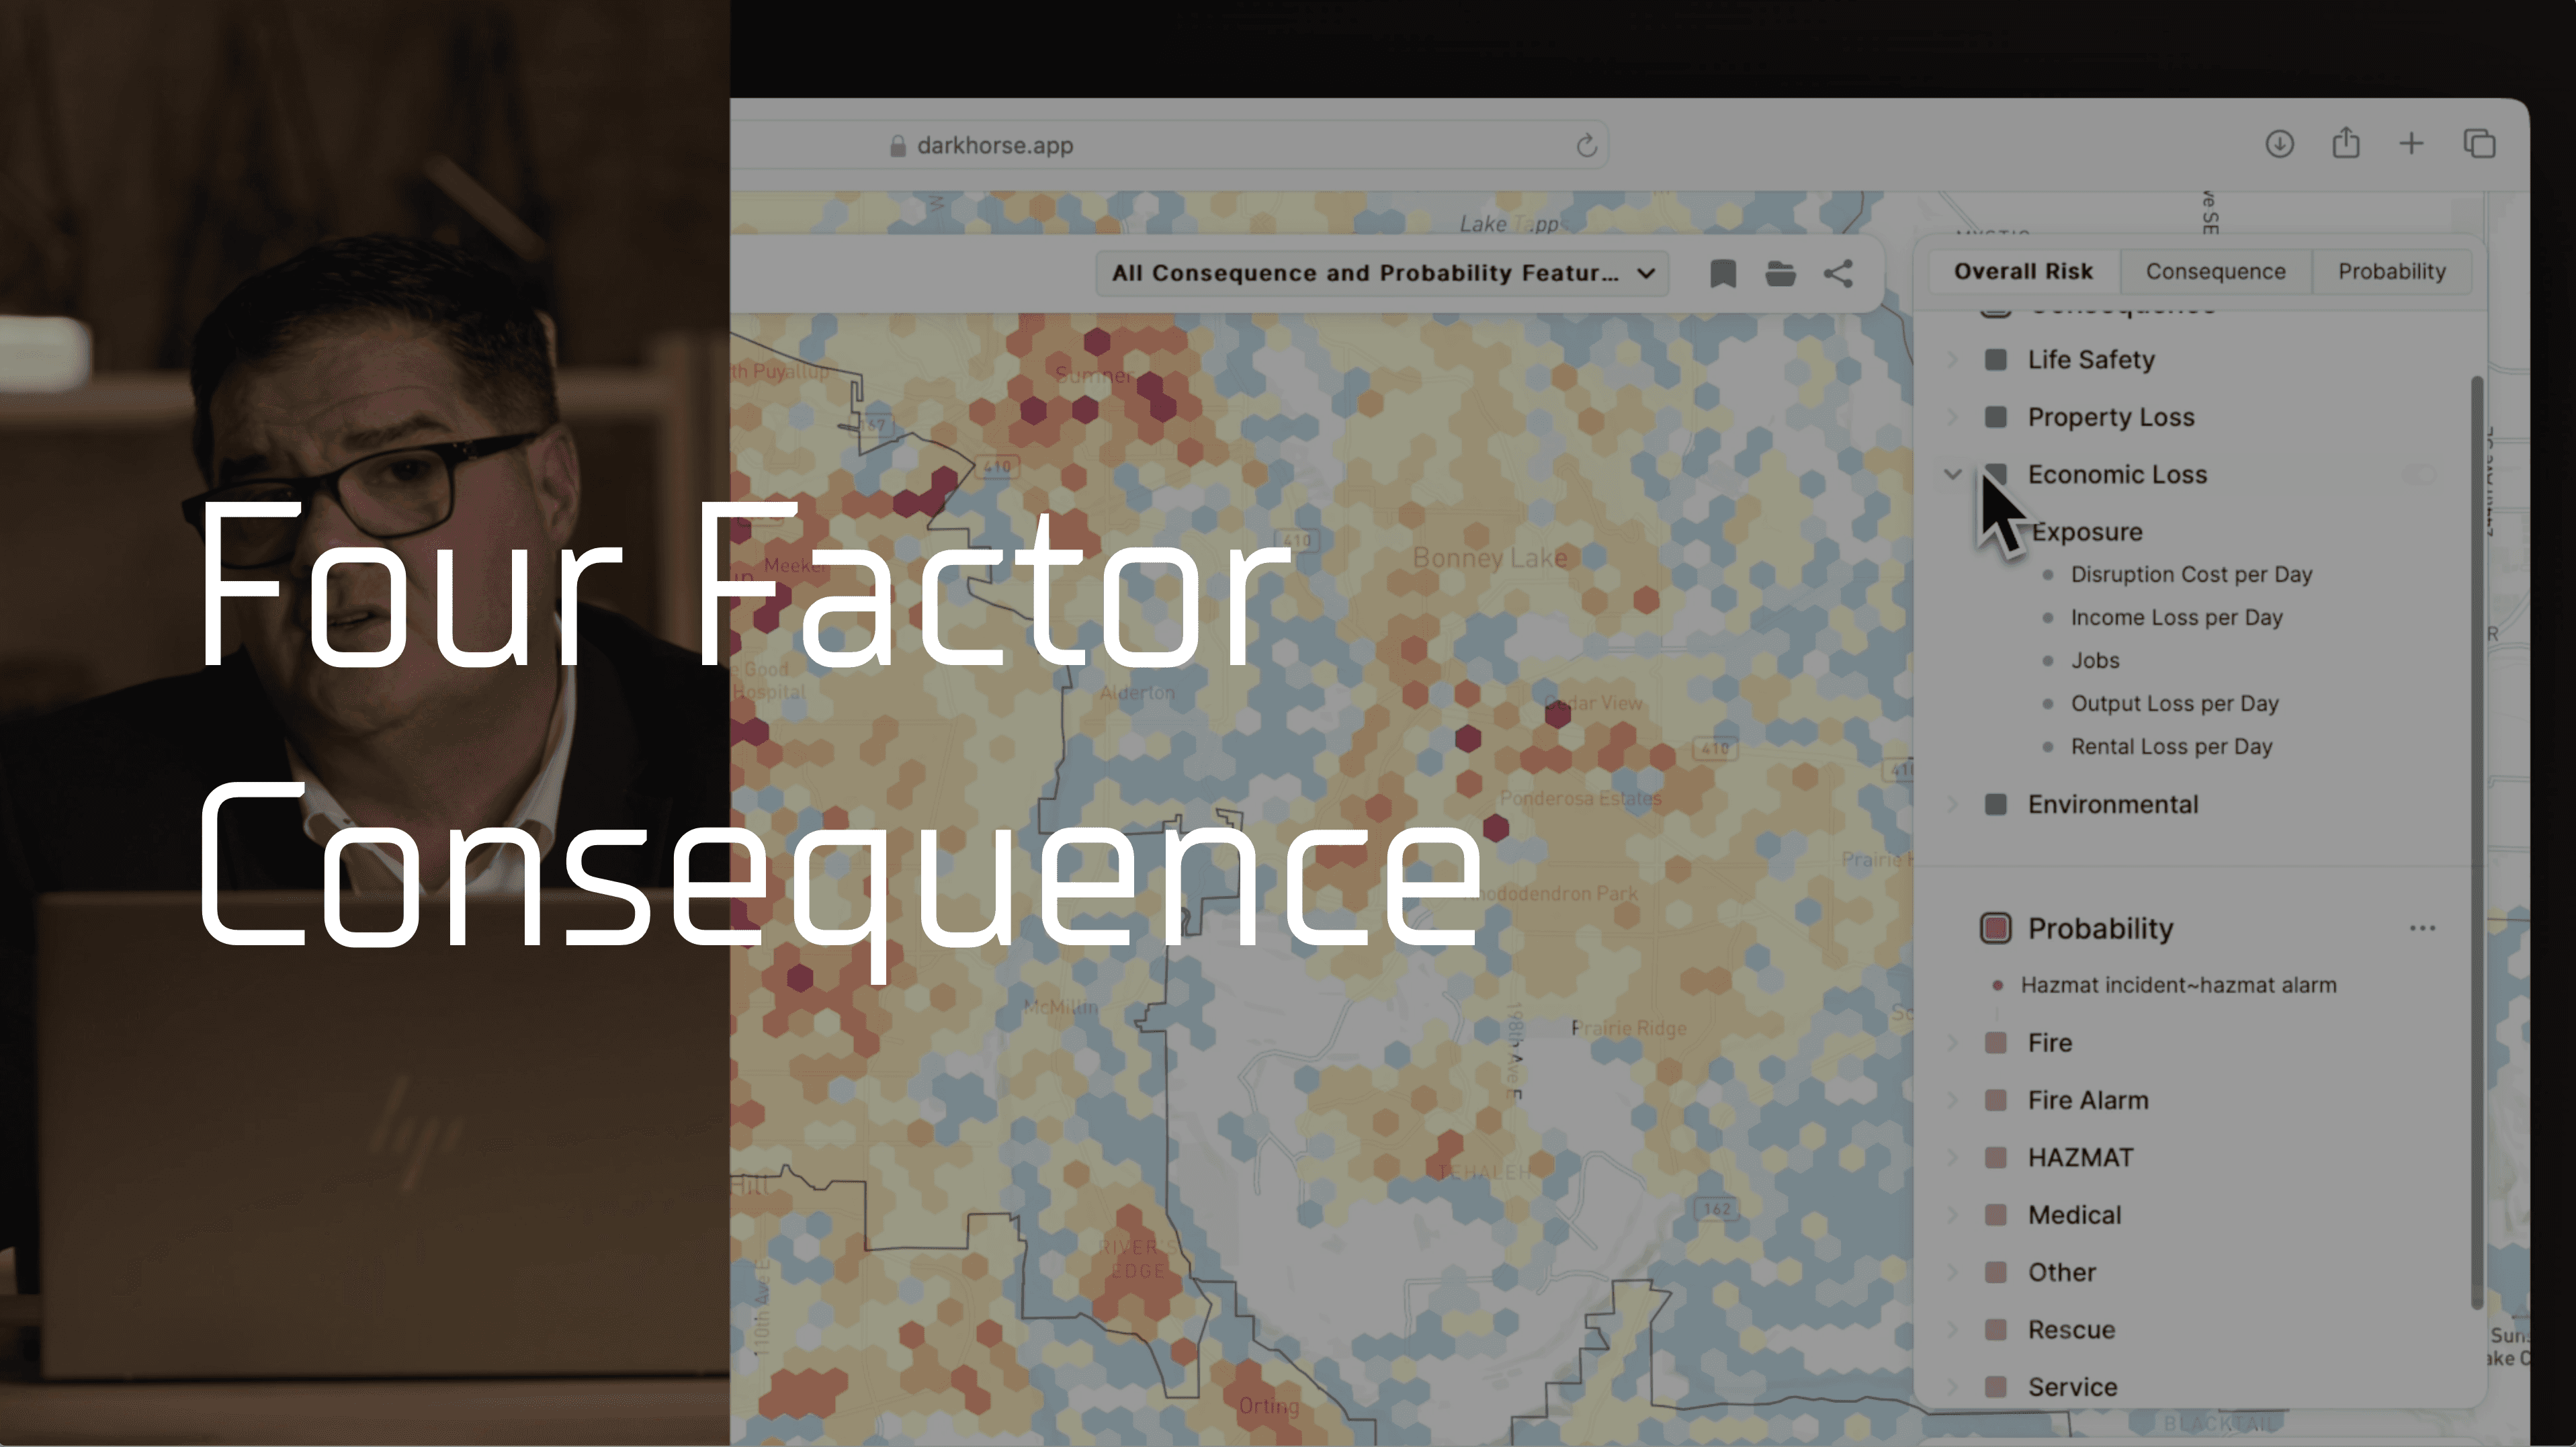
0:55
EPISODE 03
Four-Factor Consequence
DARRELL REID · RETIRED FIRE CHIEF & CAO
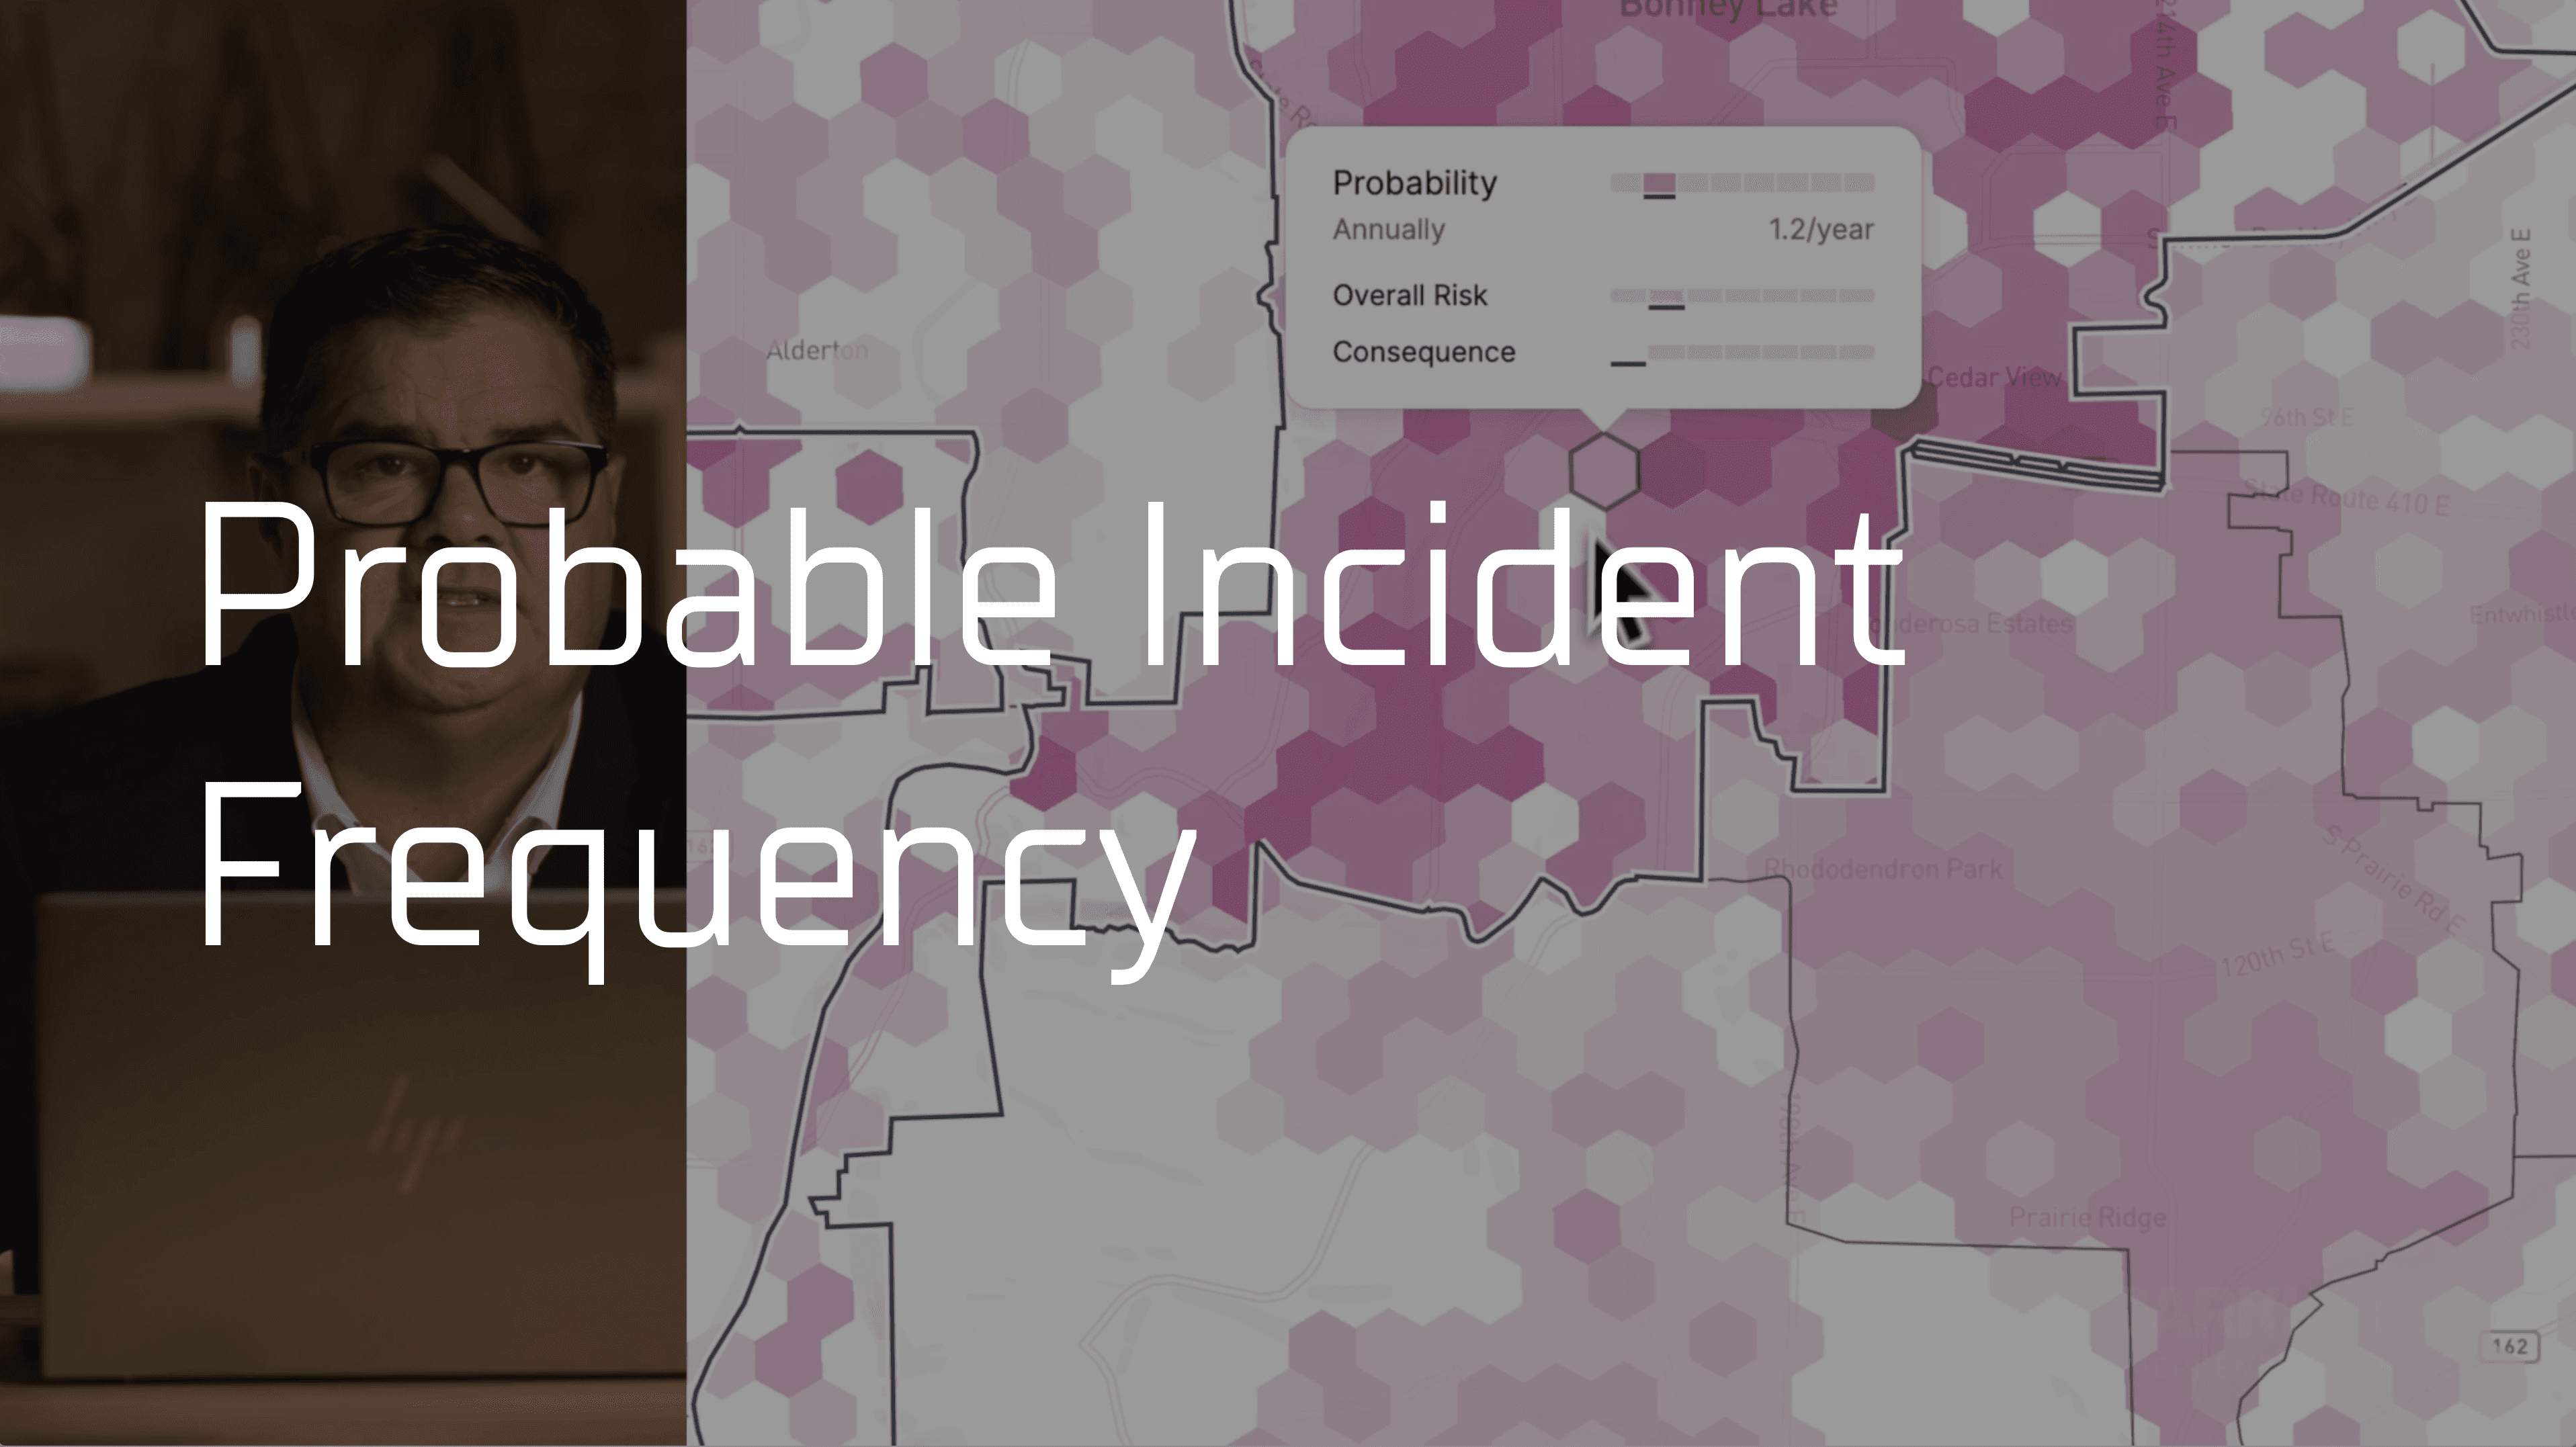
0:59
EPISODE 04
Probable Incident Frequency
DARRELL REID · RETIRED FIRE CHIEF & CAO
Reduce response costs. Reclaim your budget.
Fuel, staffing, wear on apparatus, and time lost for the next call. Prevention pays. Drag the slider and see how.
The assumptions behind this model
See the sources
15,000
calls per year
A mid-size career department serving roughly 100,000 to 150,000 residents. US fire departments answer more than 36 million calls a year, and EMS now drives close to two thirds of that volume.
30%
addressable by prevention
Not the share that disappears, the share prevention work can target: false alarm and good-intent runs (about 7% of calls), older-adult falls and repeat lift assists, low-acuity EMS, and cooking fires.
$650
blended cost per response
Crew time, apparatus, supplies, dispatch and records, plus each call’s share of station, training and admin. Budget-derived figures cluster near $550 to $700; published cost-recovery rates run $427 to $881.
A Living CRA
The old way
The binder on a dusty shelf.
Slow, expensive, and out of date before it’s printed. A one-time snapshot your community outgrows within the year.
ACCURACY OVER TIME
Darkhorse Risk
A risk picture that refreshes itself.
Continuously updated from trusted national datasets and your own records, with parcel-level insight. Always in sync with your evolving community.
ACCURACY OVER TIME
Testimonials



Next Steps
No long procurement cycles. No year-long onboarding. From data to action in days, not months.